I always enjoy watching those really slick/nice/flashy videos from Microsoft’s marketing team, thumbs up! 🙂
Here’s another one about Microsoft’s vision on data and how we’re able to analyze data today.
I always enjoy watching those really slick/nice/flashy videos from Microsoft’s marketing team, thumbs up! 🙂
Here’s another one about Microsoft’s vision on data and how we’re able to analyze data today.
Again, also 2015 will be a great year for BI! 🙂
Gartner, Inc. today highlighted the top 10 technology trends that will be strategic for most organizations in 2015.
Gartner defines a strategic technology trend as one with the potential for significant impact on the organization in the next three years. Factors that denote significant impact include a high potential for disruption to the business, end users or IT, the need for a major investment, or the risk of being late to adopt. These technologies impact the organization’s long-term plans, programs and initiatives.
“We have identified the top 10 technology trends that organizations cannot afford to ignore in their strategic planning processes,” said David Cearley, vice president & Gartner Fellow. “This does not necessarily mean adoption and investment in all of the trends at the same rate, but companies should look to make deliberate decisions about them during the next two years.”

Advanced, Pervasive and Invisible Analytics
Analytics will take center stage as the volume of data generated by embedded systems increases and vast pools of structured and unstructured data inside and outside the enterprise are analyzed. “Every app now needs to be an analytic app,” said Mr. Cearley. “Organizations need to manage how best to filter the huge amounts of data coming from the IoT, social media and wearable devices, and then deliver exactly the right information to the right person, at the right time. Analytics will become deeply, but invisibly embedded everywhere.” Big data remains an important enabler for this trend but the focus needs to shift to thinking about big questions and big answers first and big data second — the value is in the answers, not the data.
Read the full article from Gartner here.
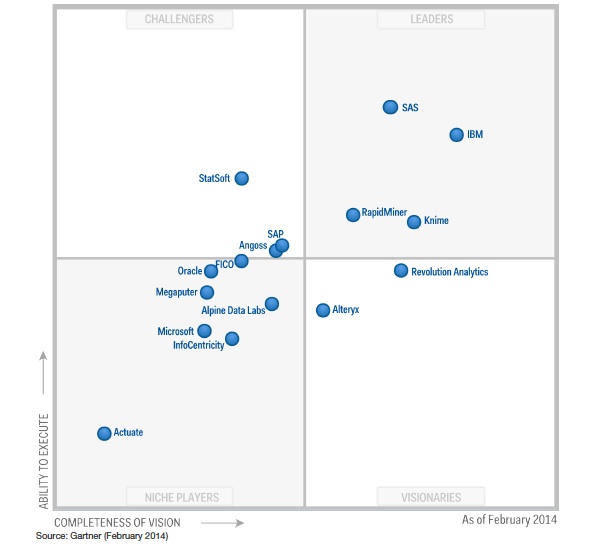
Gartner’s Magic Quadrant for Advanced Analytics Platforms 2014
Predictive analytics and other categories of advanced analytics are becoming a major factor in the analytics market. We evaluate the leading providers of advanced analytics platforms that are used to build solutions from scratch.
It’s such a pivotal moment for data scientists and the growing open-source R community that Gartner has embarked on its first ever Magic Quadrant for Advanced Analytics Platforms. Gartner estimates advanced analytics to be a $2 billion market that spans a broad array of industries globally, and ‘Gartner predicts business intelligence and analytics will remain top focus for CIOs Through 2017.’ We believe that this new Magic Quadrant puts a spotlight on big data as the great analytics disruptor which we feel highlights the need for solutions like Revolution Analytics’ that are built upon a flexible, open platform, and designed for today’s Big Data Big Analytics challenges.” — Dave Rich
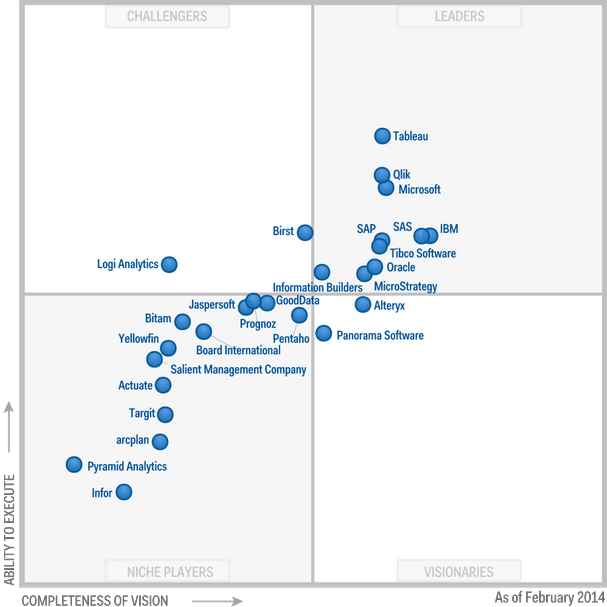
Gartner’s Magic Quadrant for Business Intelligence and Analytics Platforms 2014
Microsoft offers a competitive and expanding set of BI and analytics capabilities, packaging and pricing that appeal to Microsoft developers, independent distributors and now to business users. It does so through a combination of enhanced BI and data discovery capabilities in Office (Excel) 2013, data management capabilities in SQL Server, and collaboration, content, and user and usage management capabilities in SharePoint.
More info:
Gartner’s Magic Quadrant for Business Intelligence and Analytics Platforms 2014
As of yesterday, Power Map was released as part of Office 2013 SP1.

More info about the announcement:
Power Map for Excel Now Generally Available, Automatically Updated for Office 365
Announcing the release of Service Pack 1 for Office 2013 and SharePoint 2013
Important:
(thanks Chris Webb for the headsup!)
One important point to note here is that Power Map will only be available to Office 365 customers. If you have a standalone version of Excel, or have a regular (ie not Office 365) Professional Plus license, you will no longer be able to use Power Map. See:
http://office.microsoft.com/en-us/excel-help/power-map-for-excel-HA104204034.aspx?redir=0
Power Map for Excel New!
If you have a subscription for Microsoft Office 365 ProPlus, Office 365 Midsize Business, or for the Office 365 Enterprise E3 or E4 plans, you’ll have access to Power Map as part of the self-service business intelligence tools. To determine which subscription you have, see Office 365 ProPlus and Compare All Office 365 for Business Plans.
If you have Office 2013 Professional Plus or a standalone version of Excel 2013, you’ll be able to download and use the Power Map Preview for Excel 2013 until May 30, 2014. After that date, the preview will no longer work in any non-Office 365 subscription version of Excel.
To learn more about Power Map, see Get started with Power Map.
Join us at LinkedIn!
Don’t forget to join the ‘Microsoft Power BI‘ group on LinkedIn and stay updated!:
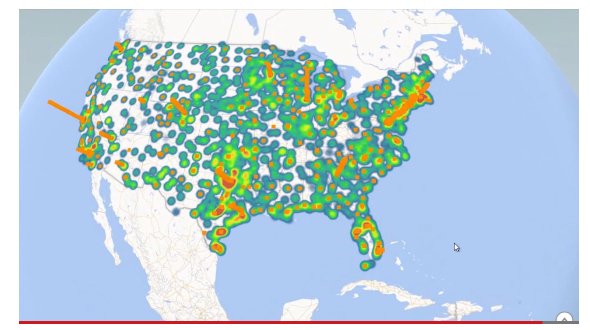
Combine Data from Various Sources with Power Query and Create a Killer Visualization with Power Map, thanks to Christina Storm
http://blogs.msdn.com/b/powerbi/archive/2013/11/18/combine-data-from-various-sources-with-power-query-and-create-a-killer-visualization-with-power-map.aspx
Unfortunately, she didn’t leave the source datasets (in Excel or CSV) for us to play with 😦
Perhaps next time?

The full demonstration on YouTube:
Join us at LinkedIn!
Don’t forget to join the ‘Microsoft Power BI‘ group on LinkedIn and stay updated!:
The SQL Server blog posted a new blog post about the new features of Power BI
Microsoft Updates Power BI for Office 365 Preview with New Natural Language Search, Mapping Capabilities
Today we’re pleased to announce the addition of significant new features to the Power BI for Office 365 preview, including natural language search with Q&A and improved experiences in two preview add-ins for Excel with 3D mapping visualizations through Power Map and improved data search in Power Query.

Search-driven data visualization with Q&A, want to see an example?
The full blog post about Power BI’s new features can be found here.
Join us at LinkedIn!
Don’t forget to join the ‘Microsoft Power BI‘ group on LinkedIn and stay updated!:
Here’s a preview of the Mobile App for Power BI (Office 365) by AJ Mee:
And here’s the presentation about Power BI by Amir Netz in WPC:
Join us at LinkedIn!
Don’t forget to join the ‘Microsoft Power BI‘ group on LinkedIn and stay updated!:
A simple overview of well-known architectures for Data Warehousing (DWH)

Source (in Dutch):
http://www.xr-magazine.nl/artikelen/1125/business-intelligence/een-eenvoudig-alternatief-voor-de-data-vault
It’s a completely different ball-game, but open-source BI/DWH is not new.
I found this full-size demo environment based on MySQL, Pentaho and Pentaho Data Integration (ETL-tool)
More info, click here.
PDI Data Vault framework
Description
A metadata driven ‘tool’ to automate loading a designed Data Vault. It consists of a set of Pentaho Data Integration and database objects. At the moment the version for MySQL includes the latest developments.
The PostgreSQL and Oracle version will be published later.Thel Virtual Machine (VMware) is a 64 bit Ubuntu Server 12.04, with MySQL (Percona Server) as the database and PDI version 4.4.0 CE.
Version management is accomplished by Git (PDI objects) and neXtep (database objects).
User/passwd : percona/percona
MySQL user/passwd : root/percona
neXtep user/passwd : nextep_user/nextep_user
More info, click here.
A possible architecture:

Thanks to Kasper de Graaf and Aly Hollander:
http://www.bi-podium.nl/mediaFiles/upload/DWHgen/Pentaho_en_DV_-_KdG.pdf
