A little while ago, I made a report to analyze the usage of SSRS report (users and rendering times).
Here’s how it works:
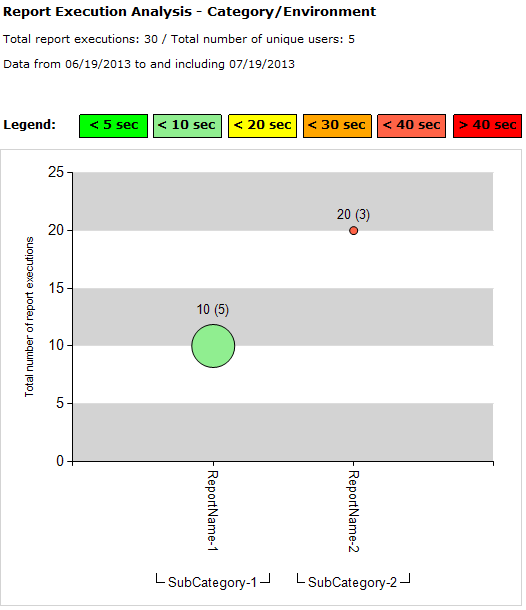
The vertical axis displays the total number of report executions, while the size (and (x) number) displays the total number of unique users.
And not to forget, color of the balloons is based on the average rendering time of that specific report.
It is pretty straight forward on how to implement it.
Download
Download the SQL Stored Procedures and SSRS report RDL-file here:
ReportExecutionAnalysis.zip
Other reports
Have a look at other reports I’ve published for my readers:


